
The States That Drink the Most Alcohol in America (2023) [MAP]
It’s no secret that Americans love to drink. According to a recent Gallup poll, more than three out of every five Americans regularly consume alcohol, with approximately 20 percent of those drinkers admitting to overindulging on occasion. Data from the National Institute on Alcohol Abuse and Alcoholism (NIAAA) upholds the poll’s findings, demonstrating that alcohol consumption in the U.S. has been trending upward since 1995.
In 2021, Americans consumed a staggering 8.1 billion gallons of alcohol (approximately 2.51 gallons per capita) by way of beer, wine, and spirits. That marks a whopping 200 million gallon increase year-over-year, likely spurred by continued Covid-19 lockdowns. Beer was the most consumed of the three categories, with Americans throwing back 6.5 billion gallons of suds that year alone. Wine and spirits were less popular, with 935 million and 680 million gallons consumed, respectively.
Among the four regions in the U.S., the South consumed the most alcohol by volume, with an annual average of just over 3 billion gallons. But when broken down per capita, the West enjoyed the most booze (2.63 gallons), and significantly more than the South’s 2.43 gallons per capita. The Northeast and the Midwest are fairly similar to each other in their consumption habits, with 1.4 billion gallons and 1.7 billion gallons consumed per year in volume and 2.54 gallons and 2.51 gallons per capita, respectively.
Curious to see how people from your home state drink? Check out our maps below to discover just how much alcohol Americans consume from state to state.
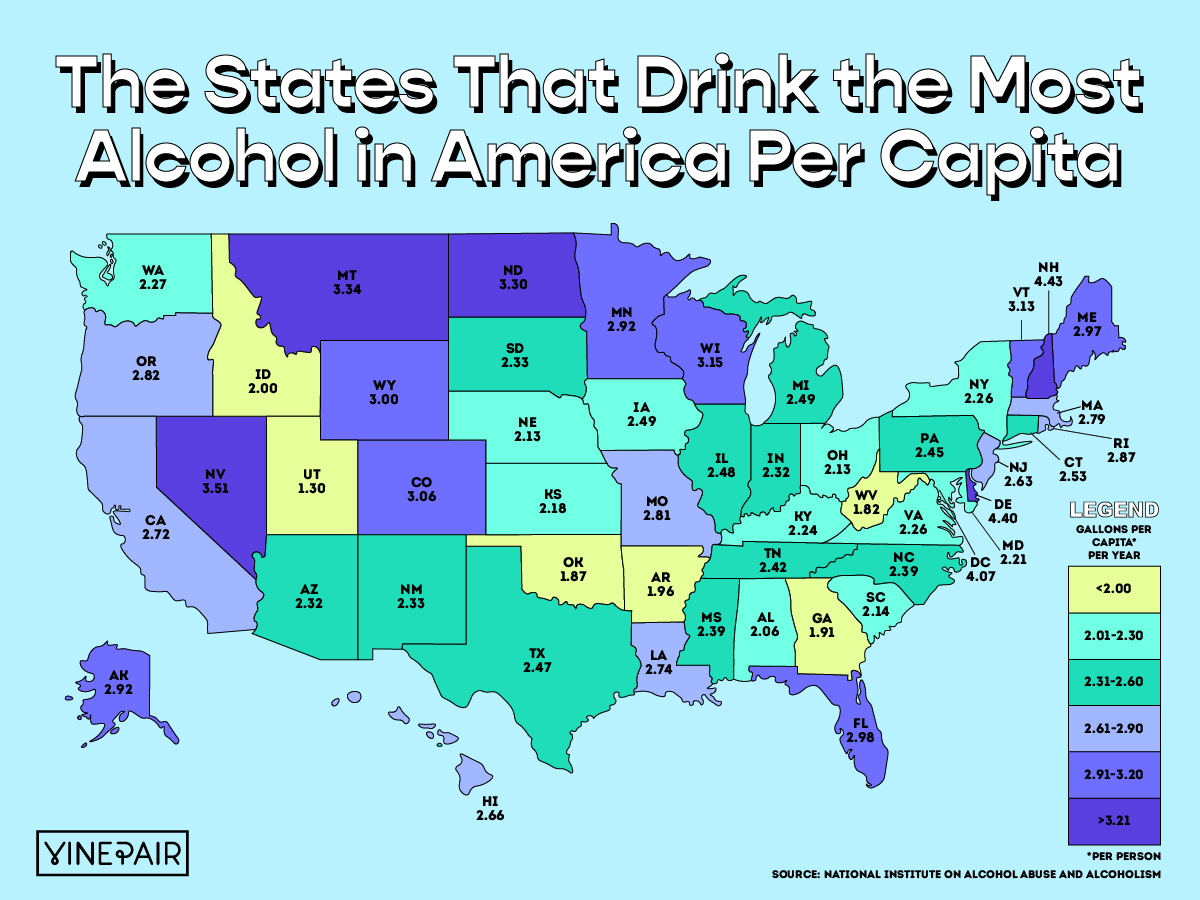
The States That Drink the Most Alcohol Per Capita
Among the 50 states and Washington D.C., New Hampshire takes the crown for the most alcohol consumed per capita, reporting 4.43 gallons per capita per year. This elevated per capita consumption could be a result of the state’s lack of sales tax on alcohol purchases, which likely attracts drinkers from other states for bargain booze. It’s a similar situation for Delaware, which reports the second-highest per capita consumption at 4.4 gallons, likely bumped up by those from Maryland, New Jersey, and Pennsylvania who stock up in the sales-tax-free state. Rounding out the top three is Washington, D.C., with 4.07 gallons of alcohol per capita, while Utah — which has some of the strictest alcohol laws in America — reports the lowest consumption per capita at just 1.3 gallons per annum.
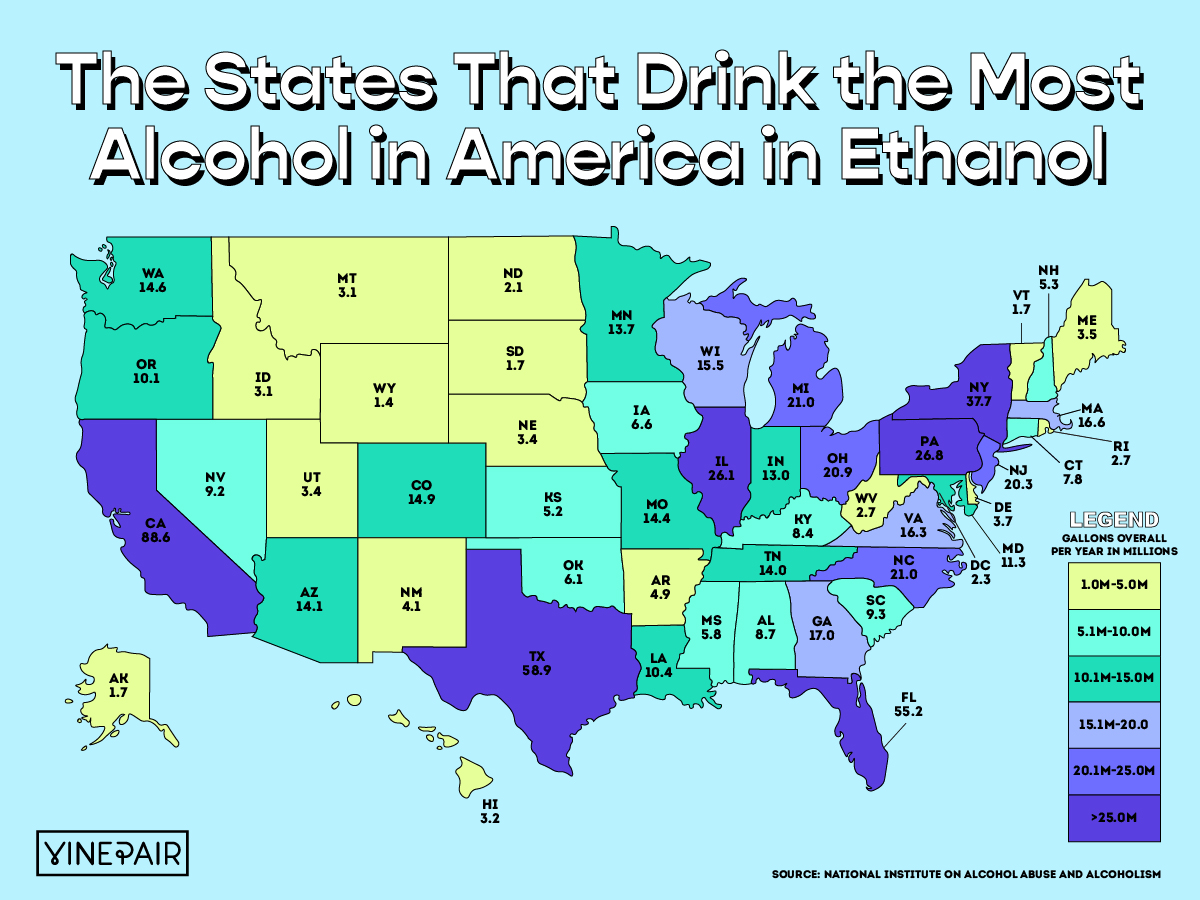
The States That Drink the Most Alcohol in Ethanol
As expected, states with the highest population numbers also consume the most alcohol by volume. Naturally, California consumes the most alcohol in raw volume with a whopping 88.6 million gallons drunk in 2021 — nearly 30 million more than runner-up Texas’s 58.9 million gallons. Floridians take the bronze, with 55.2 million gallons consumed in 2021. On the other end of the spectrum, Wyoming’s population of less than 600,000 consumes the least amount of alcohol by volume at just 1.4 million gallons.
Ranking the States
Gallons Per Capita
Rank
State
Gallons of Ethanol Per Capita*
1
New Hampshire
4.43
2
Delaware
4.40
3
Washington, D.C.
4.07
4
Nevada
3.51
5
Montana
3.34
6
North Dakota
3.30
7
Wisconsin
3.15
8
Vermont
3.13
9
Colorado
3.06
10
Wyoming
3.00
11
Florida
2.98
12
Maine
2.97
13
Alaska
2.92
14
Minnesota
2.92
15
Rhode Island
2.87
16
Oregon
2.82
17
Missouri
2.81
18
Massachusetts
2.79
19
Louisiana
2.74
20
California
2.72
21
Hawaii
2.66
22
New Jersey
2.63
23
Connecticut
2.53
24
Iowa
2.49
25
Michigan
2.49
26
Illinois
2.48
27
Texas
2.47
28
Pennsylvania
2.45
29
Tennessee
2.42
30
Mississippi
2.39
31
North Carolina
2.39
32
New Mexico
2.33
33
South Dakota
2.33
34
Arizona
2.32
35
Indiana
2.32
36
Washington
2.27
37
New York
2.26
38
Virginia
2.26
39
Kentucky
2.24
40
Maryland
2.21
41
Kansas
2.18
42
South Carolina
2.14
43
Nebraska
2.13
44
Ohio
2.13
45
Alabama
2.06
46
Idaho
2.00
47
Arkansas
1.96
48
Georgia
1.91
49
Oklahoma
1.87
50
West Virginia
1.82
51
Utah
1.30
Gallons Overall
Rank
State
Gallons Overall*
1
California
88.6M
2
Texas
58.9M
3
Florida
55.2M
4
New York
37.7M
5
Pennsylvania
26.8M
6
Illinois
26.1M
7
Michigan
21.0M
8
North Carolina
21.0M
9
Ohio
20.9M
10
New Jersey
20.3M
11
Georgia
17.0M
12
Massachusetts
16.6M
13
Virginia
16.3M
14
Wisconsin
15.5M
15
Colorado
14.9M
16
Washington
14.6M
17
Missouri
14.4M
18
Arizona
14.1M
19
Tennessee
14.0M
20
Minnesota
13.7M
21
Indiana
13.0M
22
Maryland
11.3M
23
Louisiana
10.4M
24
Oregon
10.1M
25
South Carolina
9.3M
26
Nevada
9.2M
27
Alabama
8.7M
28
Kentucky
8.4M
29
Connecticut
7.8M
30
Iowa
6.6M
31
Oklahoma
6.1M
32
Mississippi
5.8M
33
New Hampshire
5.3M
34
Kansas
5.2M
35
Arkansas
4.9M
36
New Mexico
4.1M
37
Delaware
3.7M
38
Maine
3.5M
39
Nebraska
3.4M
40
Utah
3.4M
41
Hawaii
3.2M
42
Idaho
3.1M
43
Montana
3.1M
44
Rhode Island
2.7M
45
West Virginia
2.7M
46
Washington, D.C.
2.3M
47
North Dakota
2.1M
48
Alaska
1.7M
49
South Dakota
1.7M
50
Vermont
1.7M
51
Wyoming
1.4M
*This data uses an estimate of average ethanol content of sold or shipped spirits into gallons of ethanol (pure alcohol) before calculating per capita consumption estimates. For this data, the alcohol by volume value is 0.129 for wine, 0.045 for beer, and 0.411 for spirits.
*Image retrieved from LIGHTFIELD STUDIOS via stock.adobe.com
The article The States That Drink the Most Alcohol in America (2023) [MAP] appeared first on VinePair.