
The States That Drink the Most Beer in America (2023) [Map]
Americans love to drink, but when it comes down to what they love drinking most, the answer will probably always be beer. With well over 9,000 operational breweries across the country — and over $6 billion worth of suds imported — data from the National Institute on Alcohol Abuse and Alcoholism (NIAAA) shows that a whopping 6.5 billion gallons of beer was consumed in the U.S. in 2021. That figure blows wine’s 935 million gallons out of the water, and makes spirits’ 680 million gallons feel like nothing more than a drop in the bucket.
When broken down by region, the South consumed the most beer in 2021 with a total of 2.5 billion gallons drunk, while the Northeast drank the least, amassing approximately 1 billion gallons. But when analyzed on a per capita basis, it’s actually the Midwest that consumed the most beer at 1.09 gallons per capita, followed by the South and West at 1.07 gallons per capita each, and lastly the Northeast at just 1.01 gallons.
Curious to learn more about your home state’s beer consumption and how it compares to your neighbors? Check out our maps below to discover how much beer your state drinks by volume and per capita.
The States That Drink the Most Beer Per Capita
While New Hampshire comes in first for per capita consumption, it’s important to note that the state enjoys a lack of alcohol taxation, which attracts drinkers from neighboring states like Vermont and Maine. Montana and Vermont round out the remainder of the top three, each of which is home to dozens of craft breweries despite their states’ small population sizes.
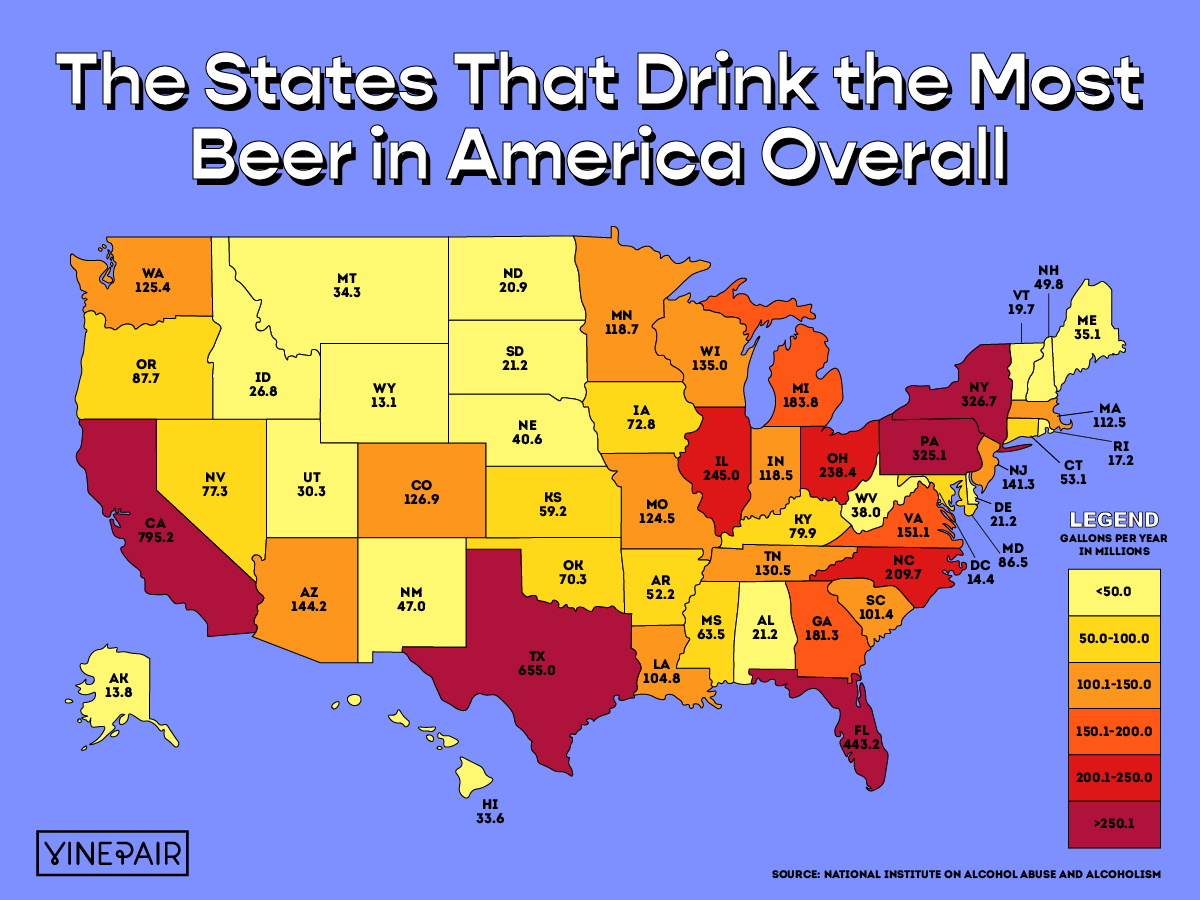
The States That Drink the Most Beer Overall
Naturally, the most highly populated states in America are the states that consume the most beer, with California — the most populous state in the U.S. — leading the pack with 795.2 million gallons of beer drunk in 2021. Texas and Florida claim the second and third spots, reporting consumption volumes of 655 million and 443.2 million gallons, respectively.
Ranking the States: Gallons Per Capita
Rank
State
Gallons of Ethanol Per Capita*
1
New Hampshire
1.87
2
Montana
1.67
3
Vermont
1.59
4
North Dakota
1.49
5
Pennsylvania
1.34
6
Maine
1.33
7
Nevada
1.33
8
South Dakota
1.31
9
Hawaii
1.26
10
Iowa
1.24
11
Louisiana
1.24
12
Texas
1.24
13
Wisconsin
1.23
14
Wyoming
1.23
15
New Mexico
1.20
16
Mississippi
1.18
17
Colorado
1.17
18
Washington, D.C.
1.15
19
Nebraska
1.15
20
Minnesota
1.14
21
Delaware
1.13
22
West Virginia
1.13
23
Kansas
1.11
24
California
1.10
25
Missouri
1.10
26
Ohio
1.10
27
Oregon
1.10
28
Florida
1.08
29
Arizona
1.07
30
North Carolina
1.07
31
Alaska
1.07
32
South Carolina
1.05
33
Illinois
1.04
34
Tennessee
1.01
35
Alabama
1.00
36
Michigan
0.98
37
Oklahoma
0.97
38
Kentucky
0.96
39
Indiana
0.95
40
Arkansas
0.94
41
Virginia
0.94
42
Georgia
0.92
43
New York
0.88
44
Washington
0.88
45
Massachusetts
0.85
46
New Jersey
0.82
47
Rhode Island
0.82
48
Connecticut
0.78
49
Idaho
0.78
50
Maryland
0.76
51
Utah
0.52
Ranking the States: Gallons Overall
Rank
State
Gallons Overall
1
California
795.2M
2
Texas
655.0M
3
Florida
443.2M
4
New York
326.7M
5
Pennsylvania
325.1M
6
Illinois
245.0M
7
Ohio
238.4M
8
North Carolina
209.7M
9
Michigan
183.8M
10
Georgia
181.3M
11
Virginia
151.1M
12
Arizona
144.2M
13
New Jersey
141.3M
14
Wisconsin
135.0M
15
Tennessee
130.5M
16
Colorado
126.9M
17
Washington
125.4M
18
Missouri
124.5M
19
Minnesota
118.7M
20
Indiana
118.5M
21
Massachusetts
112.5M
22
Louisiana
104.8M
23
South Carolina
101.4M
24
Oregon
87.7M
25
Maryland
86.5M
26
Kentucky
79.9M
27
Nevada
77.3M
28
Iowa
72.8M
29
Oklahoma
70.3M
30
Mississippi
63.5M
31
Kansas
59.2M
32
Connecticut
53.1M
33
Arkansas
52.2M
34
New Hampshire
49.8M
35
New Mexico
47.0M
36
Nebraska
40.6M
37
West Virginia
38.0M
38
Maine
35.1M
39
Montana
34.3M
40
Hawaii
33.6M
41
Utah
30.3M
42
Idaho
26.8M
43
Alabama
21.2M
44
Delaware
21.2M
45
South Dakota
21.2M
46
North Dakota
20.9M
47
Vermont
19.7M
48
Rhode Island
17.2M
49
Washington, D.C.
14.4M
50
Alaska
13.8M
51
Wyoming
13.1M
*This data uses an estimate of average ethanol content of sold or shipped beer into gallons of ethanol (pure alcohol) before calculating per capita consumption estimates. For this data, the alcohol by volume value for beer is 0.045.
*Image retrieved from Rawf8 via stock.adobe.com
The article The States That Drink the Most Beer in America (2023) [Map] appeared first on VinePair.